EXOS - Container
EXOS
DASHBOARD
Docker containers and their usage have revolutionized the way applications and the underlying operating system are packaged and deployed to development, testing, and production systems.
The Platform is an integrated software/hardware providing distributed compute, storage and the network allowing the organization to consume the infrastructure in a more efficient, agile, self-serving manner
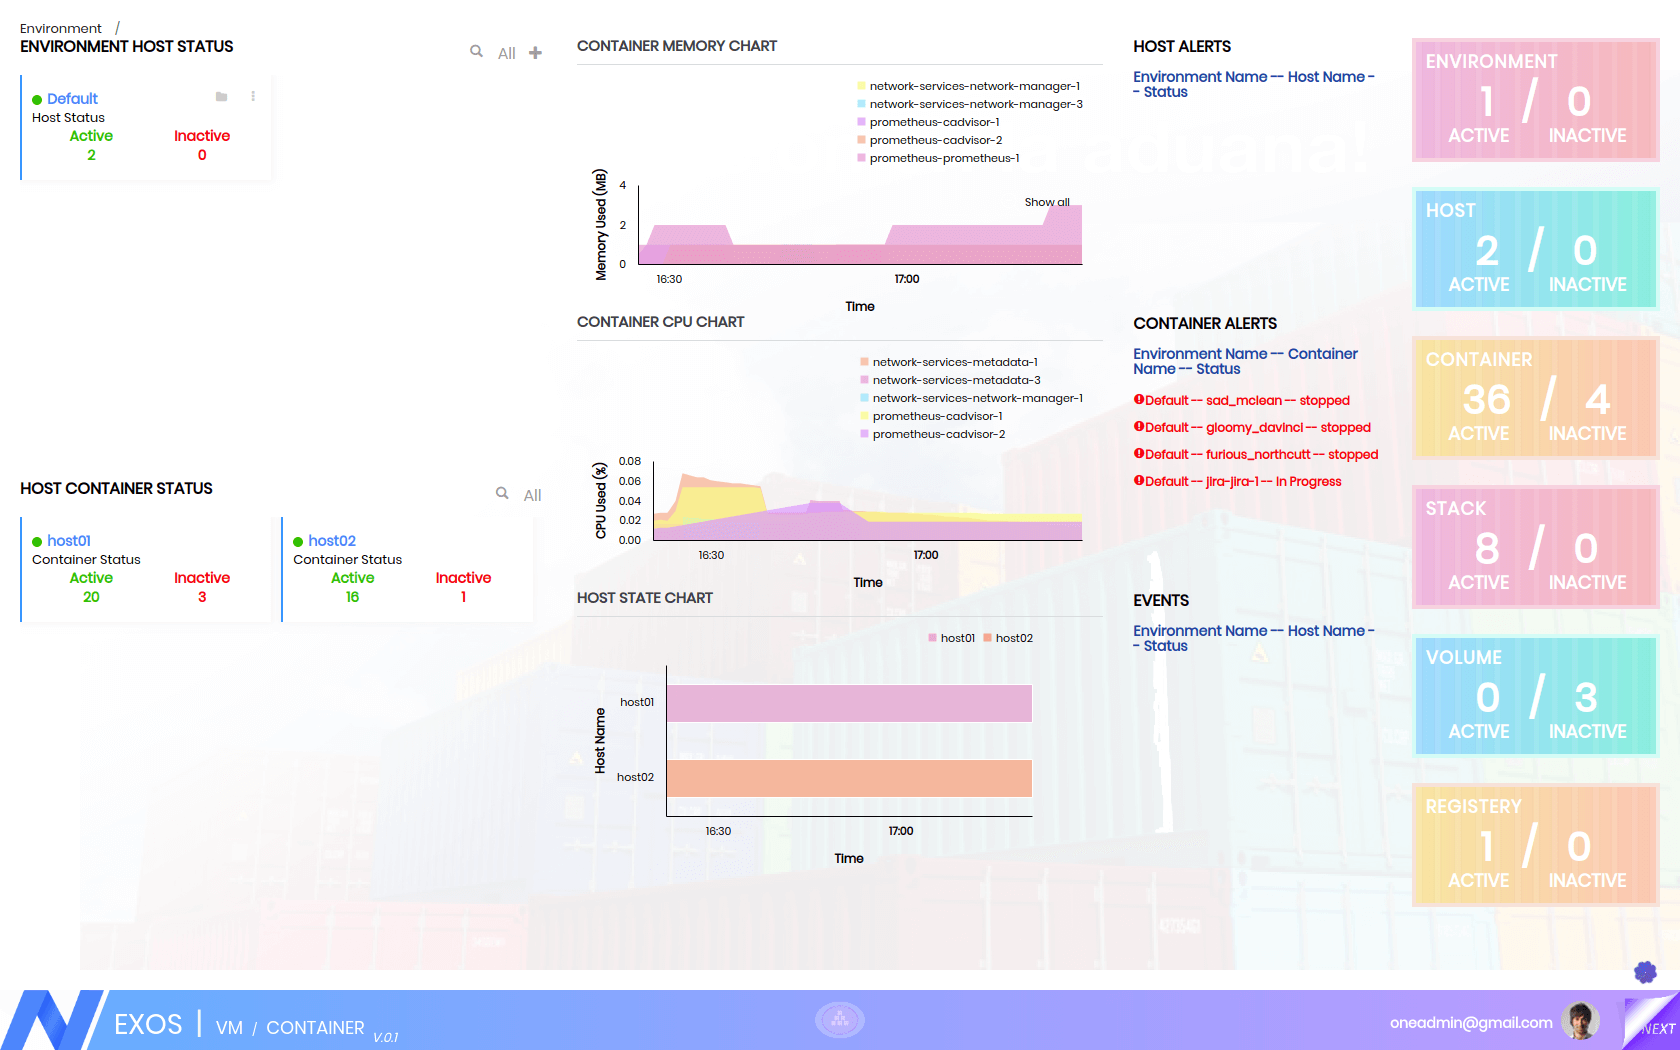
EXOS Container Dashboard provides a bird’s eye view of the Container Deployment of an Enterprise.
The dashboard provides a Holistic Snapshot of Container Deployment. It lists the Top 5 Environment (Dev, QA, Prod etc) which require immediate Intervention. Each Environment provides isolation of resources (docker host, container) and allocation of these resources to Users and Groups from Other Environment.
The Dashboard also lists the Top 5 Docker Host which requires immediate attention. It also provides real-time charts of Top Containers in terms of CPU, Memory. It also provides a Timeline distribution of Host Status
The information Labels provides the bird's eye view of the numerical context of the Environment, Host, Volume, Registry, Services as well as Containers. The dashboard will show only the information in context to the user logged. Thus this information is context specific.
APPLICATION STACK VISIBILITY
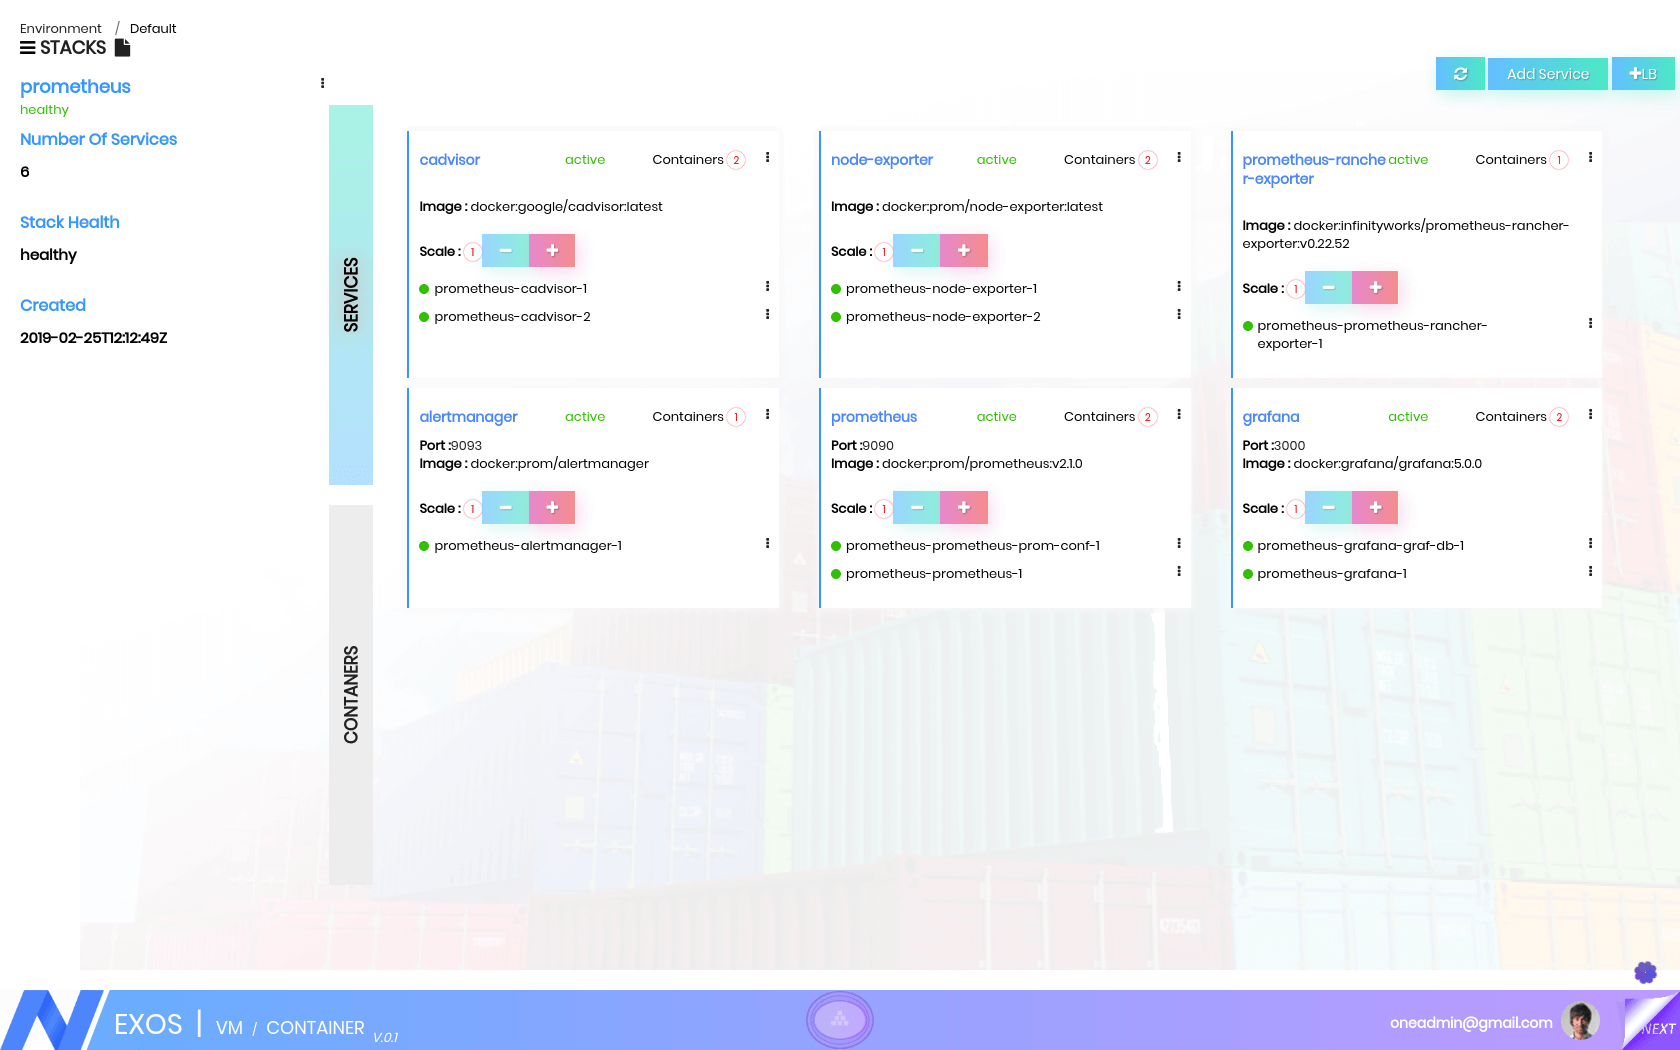
A stack is a group of services. Stacks can be used to group together services that together implement an application. It defines a basic service as one or more containers created from the same image.
Once a service (consumer) is linked to another service (producer) within the same stack, a DNS record mapped to each container instance is automatically created and discoverable by containers from the “consuming” service.
A container is a standard unit of software that packages up the code and all its dependencies so the application runs quickly and reliably from one computing environment to another.
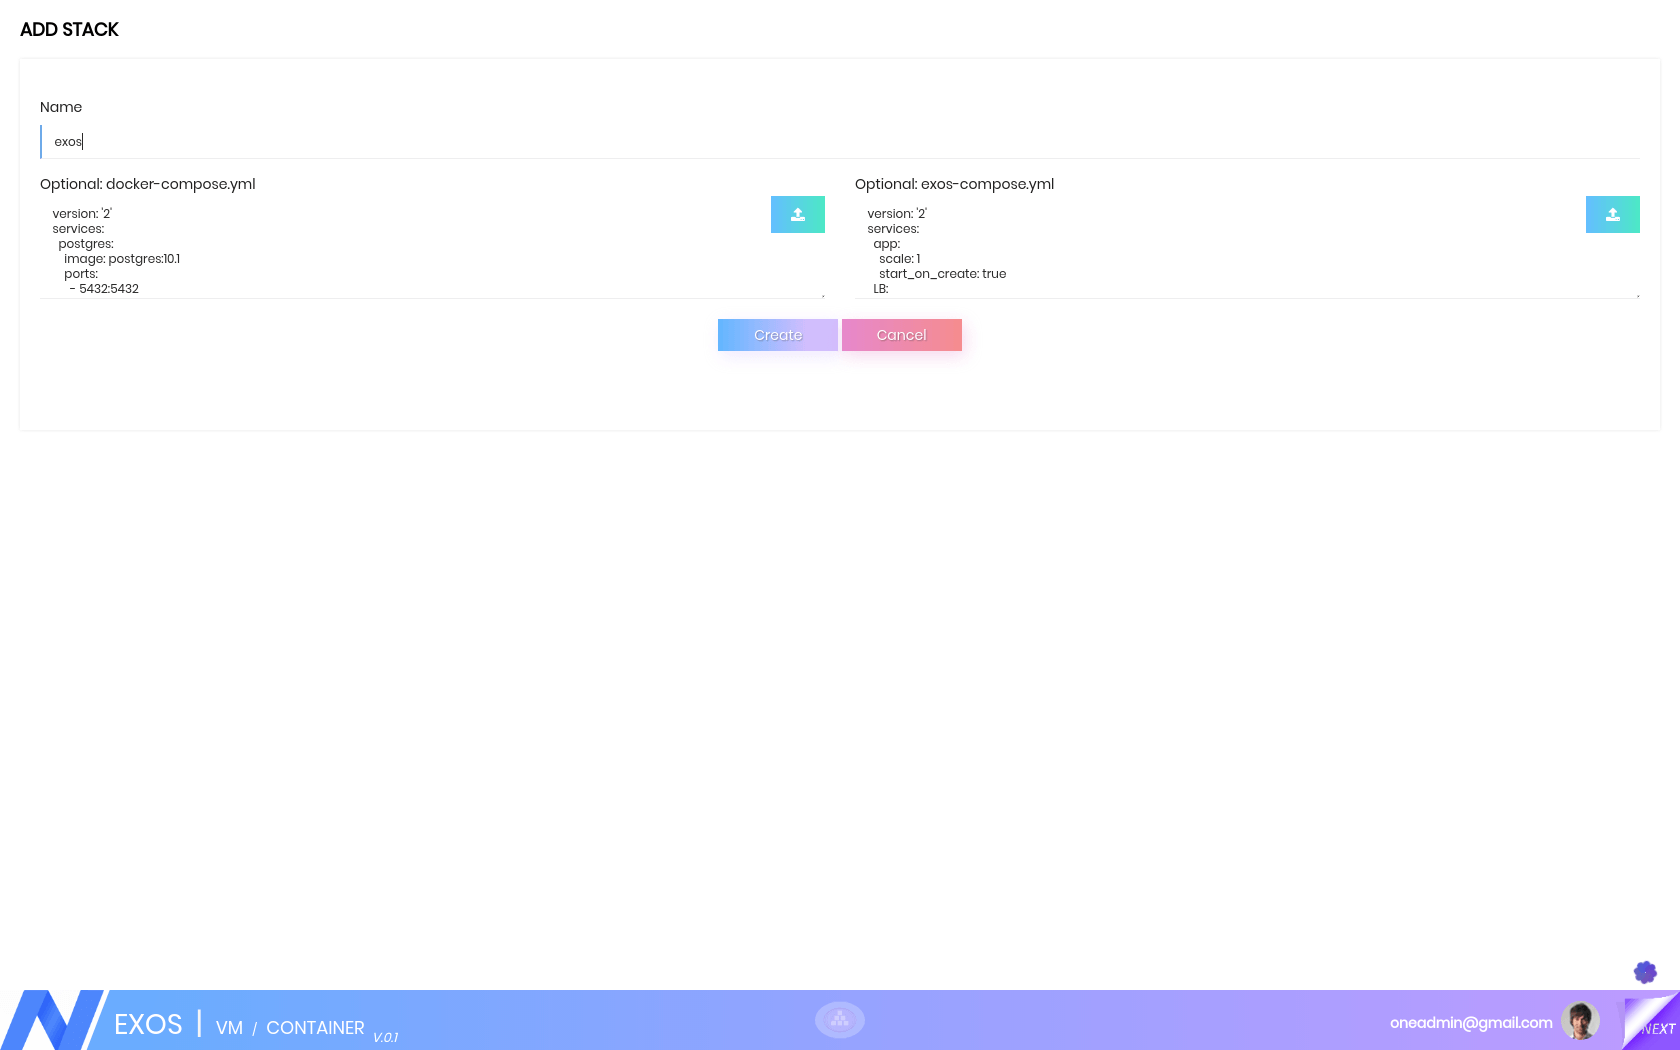
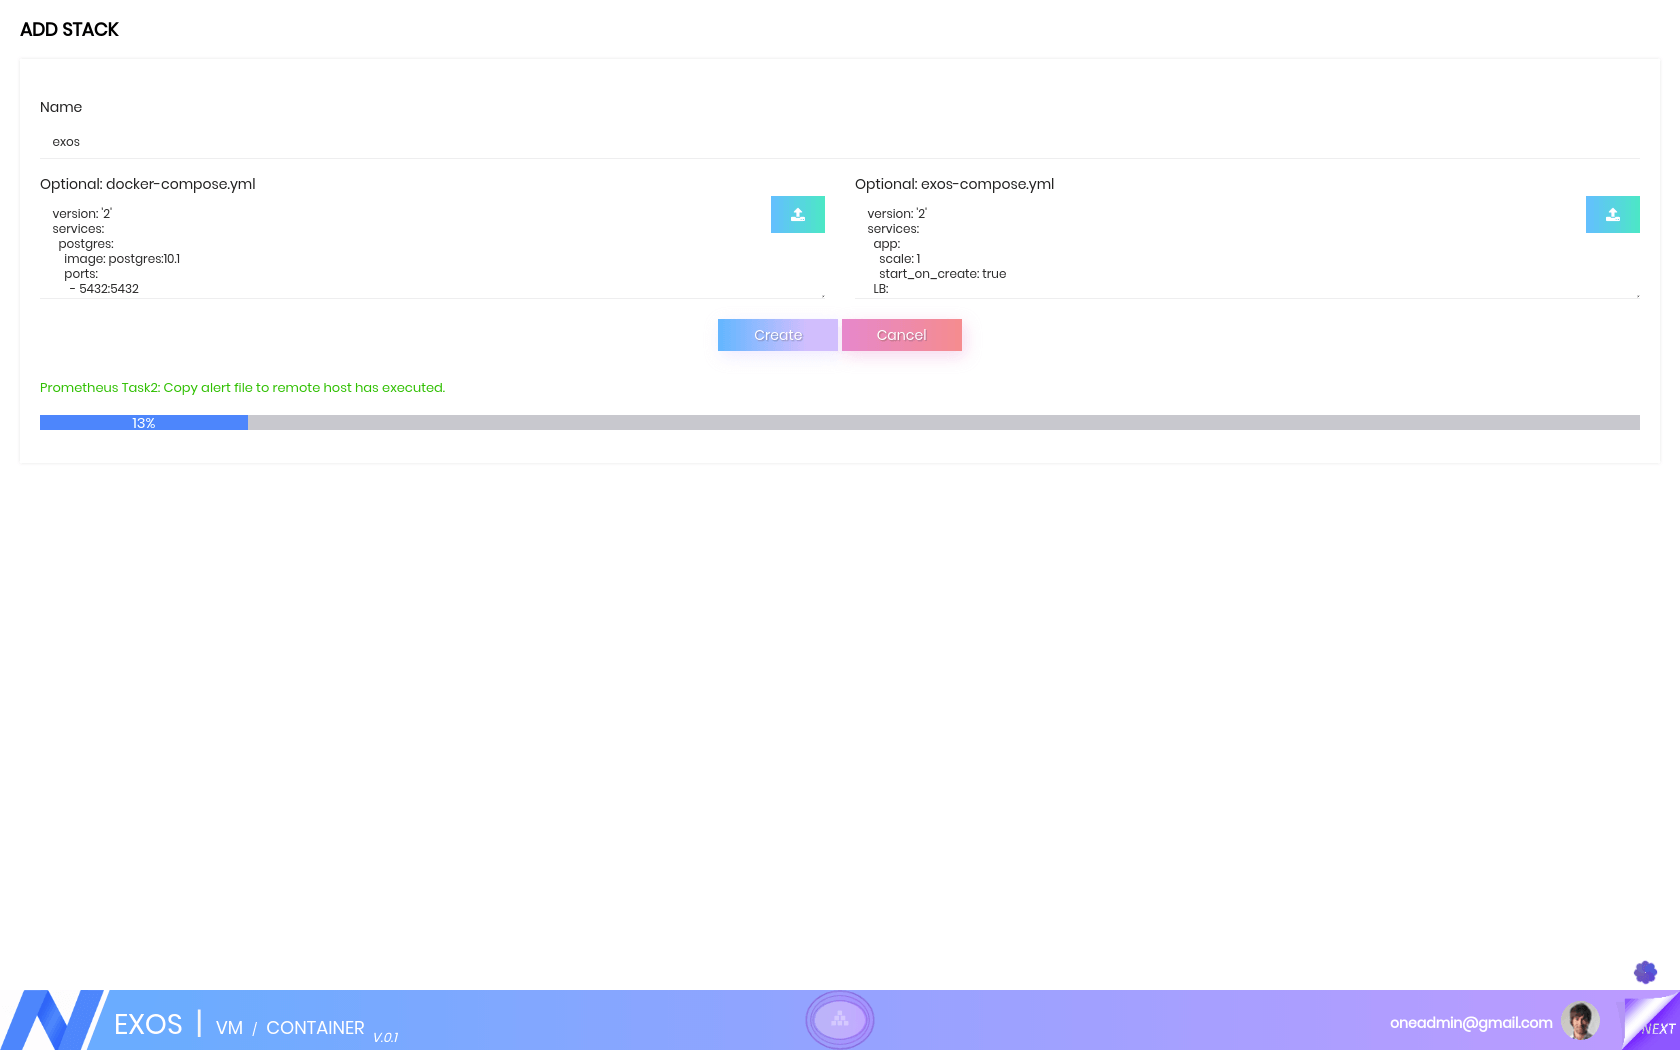
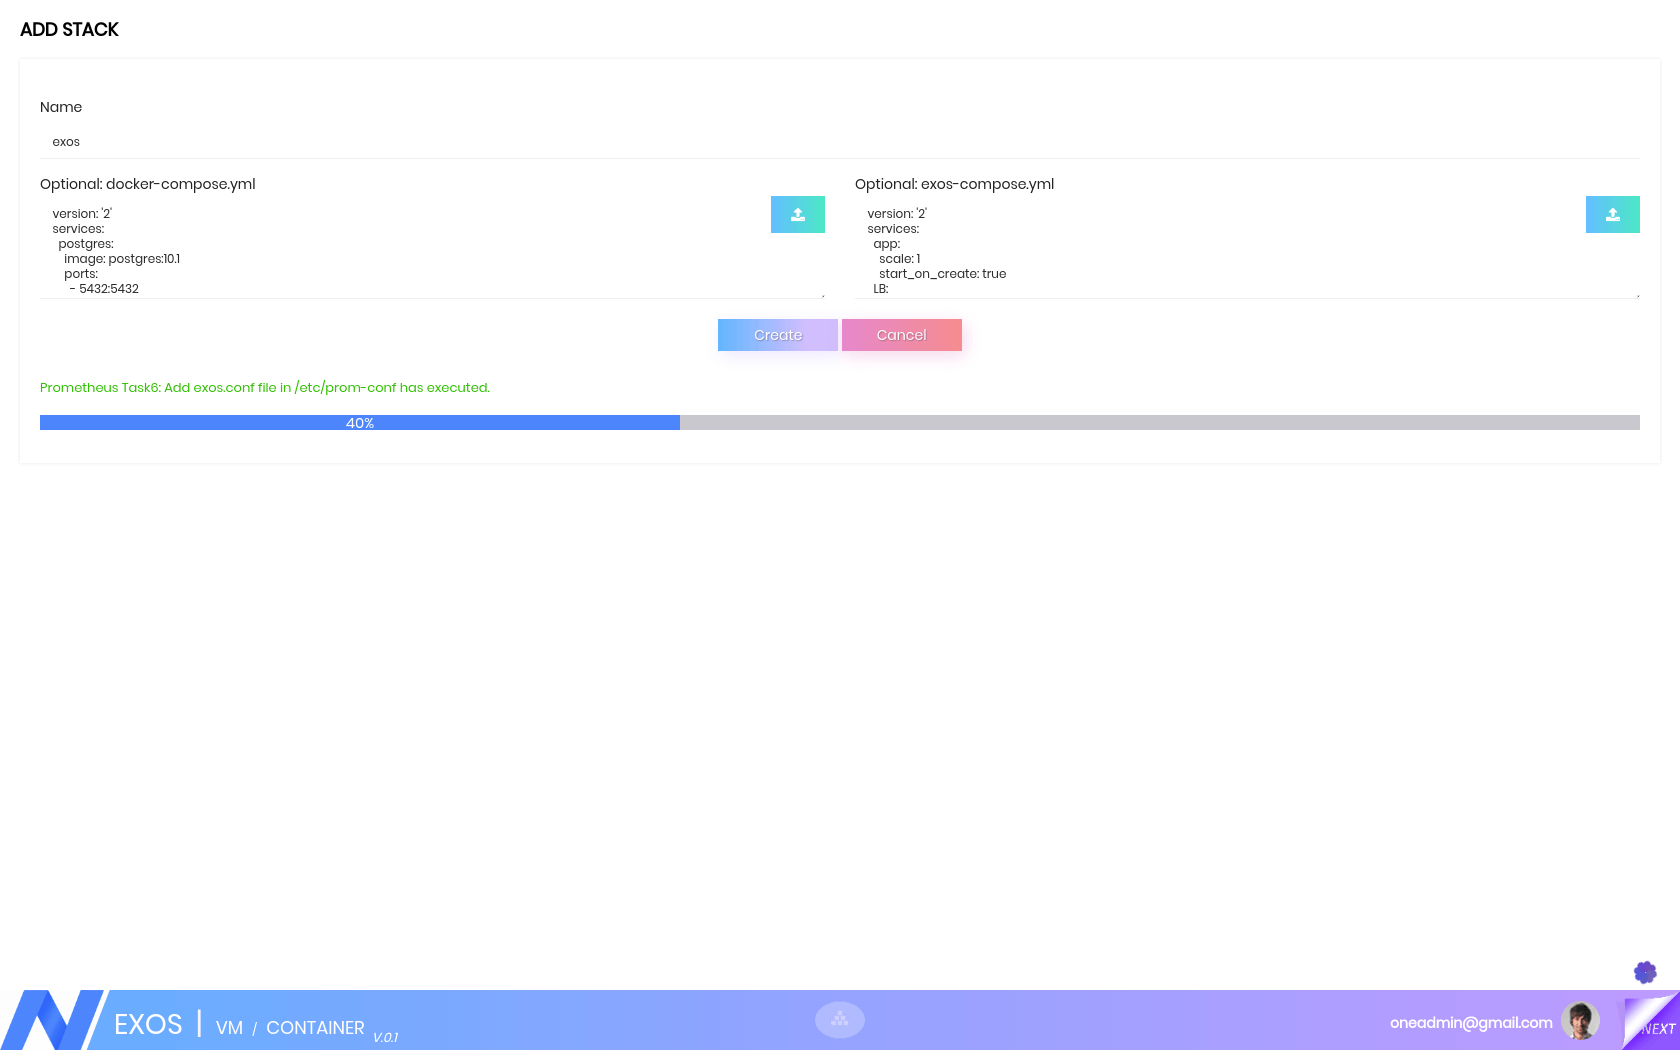
The EXOS Platform provides an option to define Application in terms of Docker-Compose format. An application is defined by a Docker-compose and an exos-compose file and can be deployed easily with the default configurations. The Stack will contain a set of Services (like Web Service, DB Service). Each Service contains one or more containers. The EXOS Container Platform will provide complete visibility at the Stack level, or at the service level abstraction or at the container level abstraction.
The Application Stack Visibility will assist the developer in looking at the right service for their debugging as well as their development. The Stack page would categorize the information both in terms of Services or in terms of the containers. So the User will be able to view the application either as a set of services or as a set of containers and can take appropriate actions.
CI/CD PIPELINE
Continuous integration is a combination of philosophy, practices driving the development teams to implement small chunks of code changes and check in code to version control repositories frequently.
The technical goal of CI is to establish a consistent and automated way to build, package, and test applications. With consistency in the integration process in place, teams are more likely to commit code changes more frequently, which lead to better collaboration and software quality.
Continuous delivery picks up where continuous integration ends. CD automates the delivery of applications to selected infrastructure environments. Most teams work with multiple environments other than the production, such as development and testing environments, and CD ensures there is an automated way to push code changes to them. CI/CD bridges the gap between development and operations teams by automating build, test, and deployment of applications.
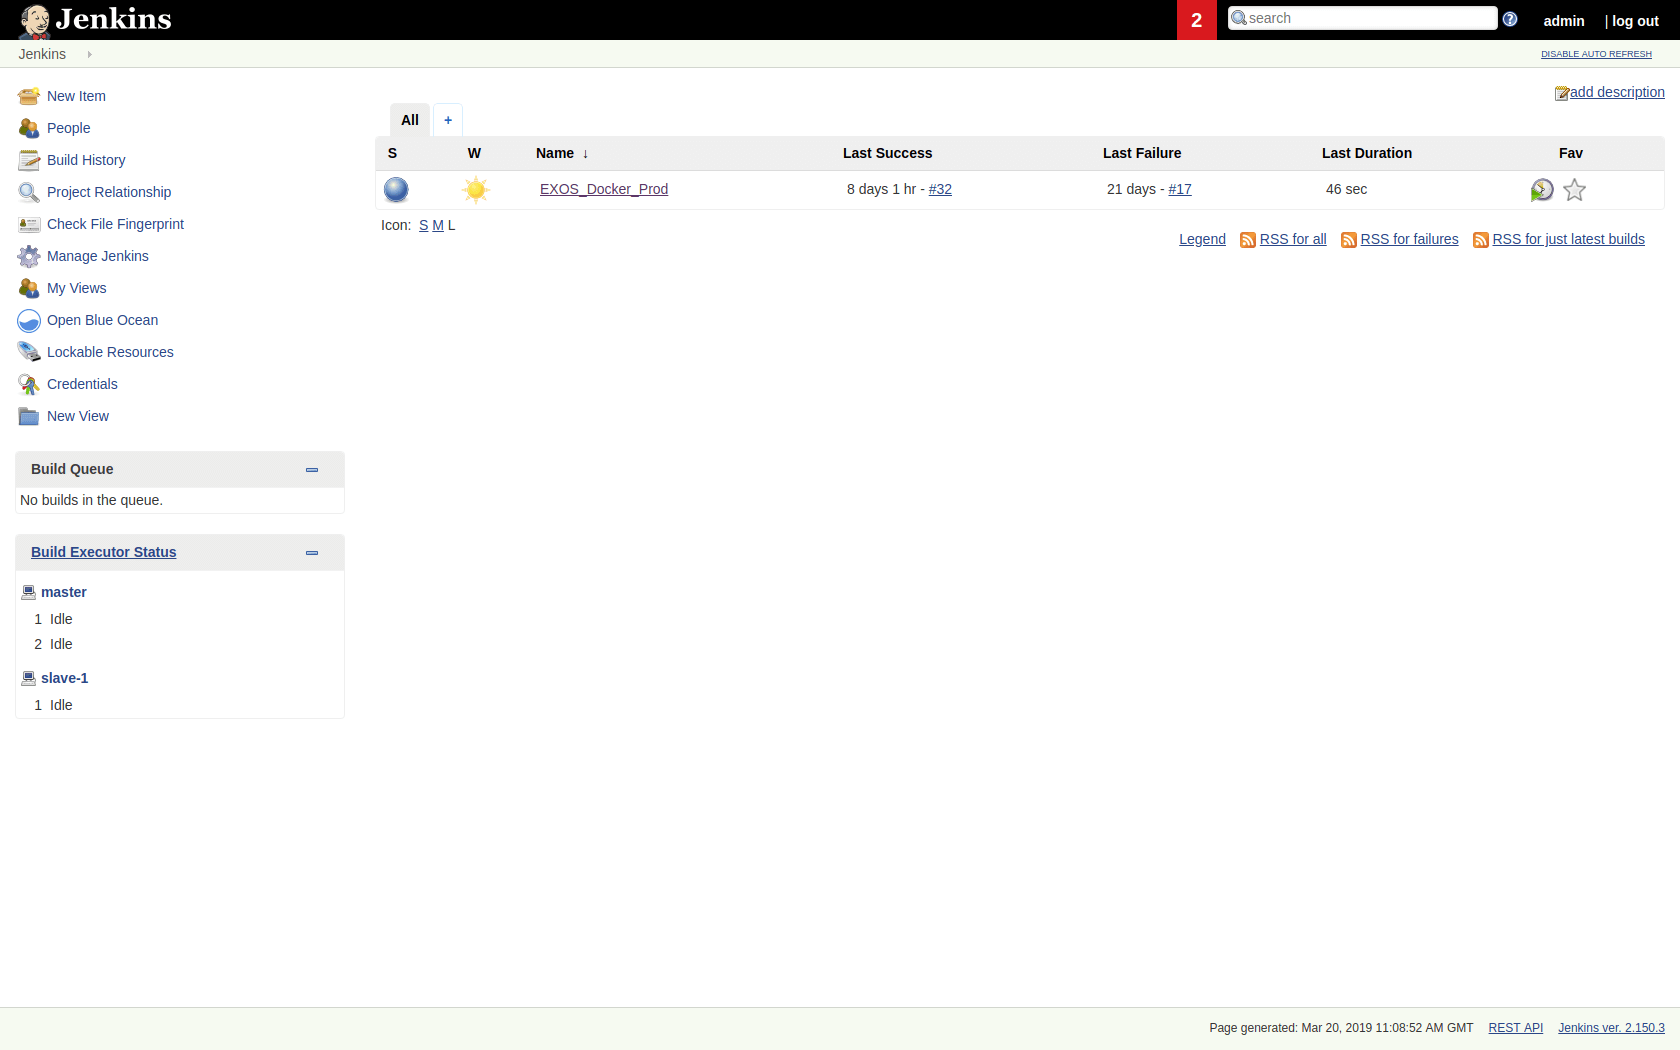
Jenkins is a cross-platform, continuous integration and continuous delivery application that can be used to build and test your software projects continuously making it easier for developers to integrate changes to the project, and making it easier for users to obtain a fresh build, which in turn increases your productivity. When you are working on a number of projects which get built on a regular basis or want to run multiple jobs or might need several different environments to test your builds, then a single Jenkins server cannot simply handle the entire load. To address the above-stated needs, Jenkins distributed architecture was introduced. Jenkins uses a Master-Slave architecture to manage distributed builds.
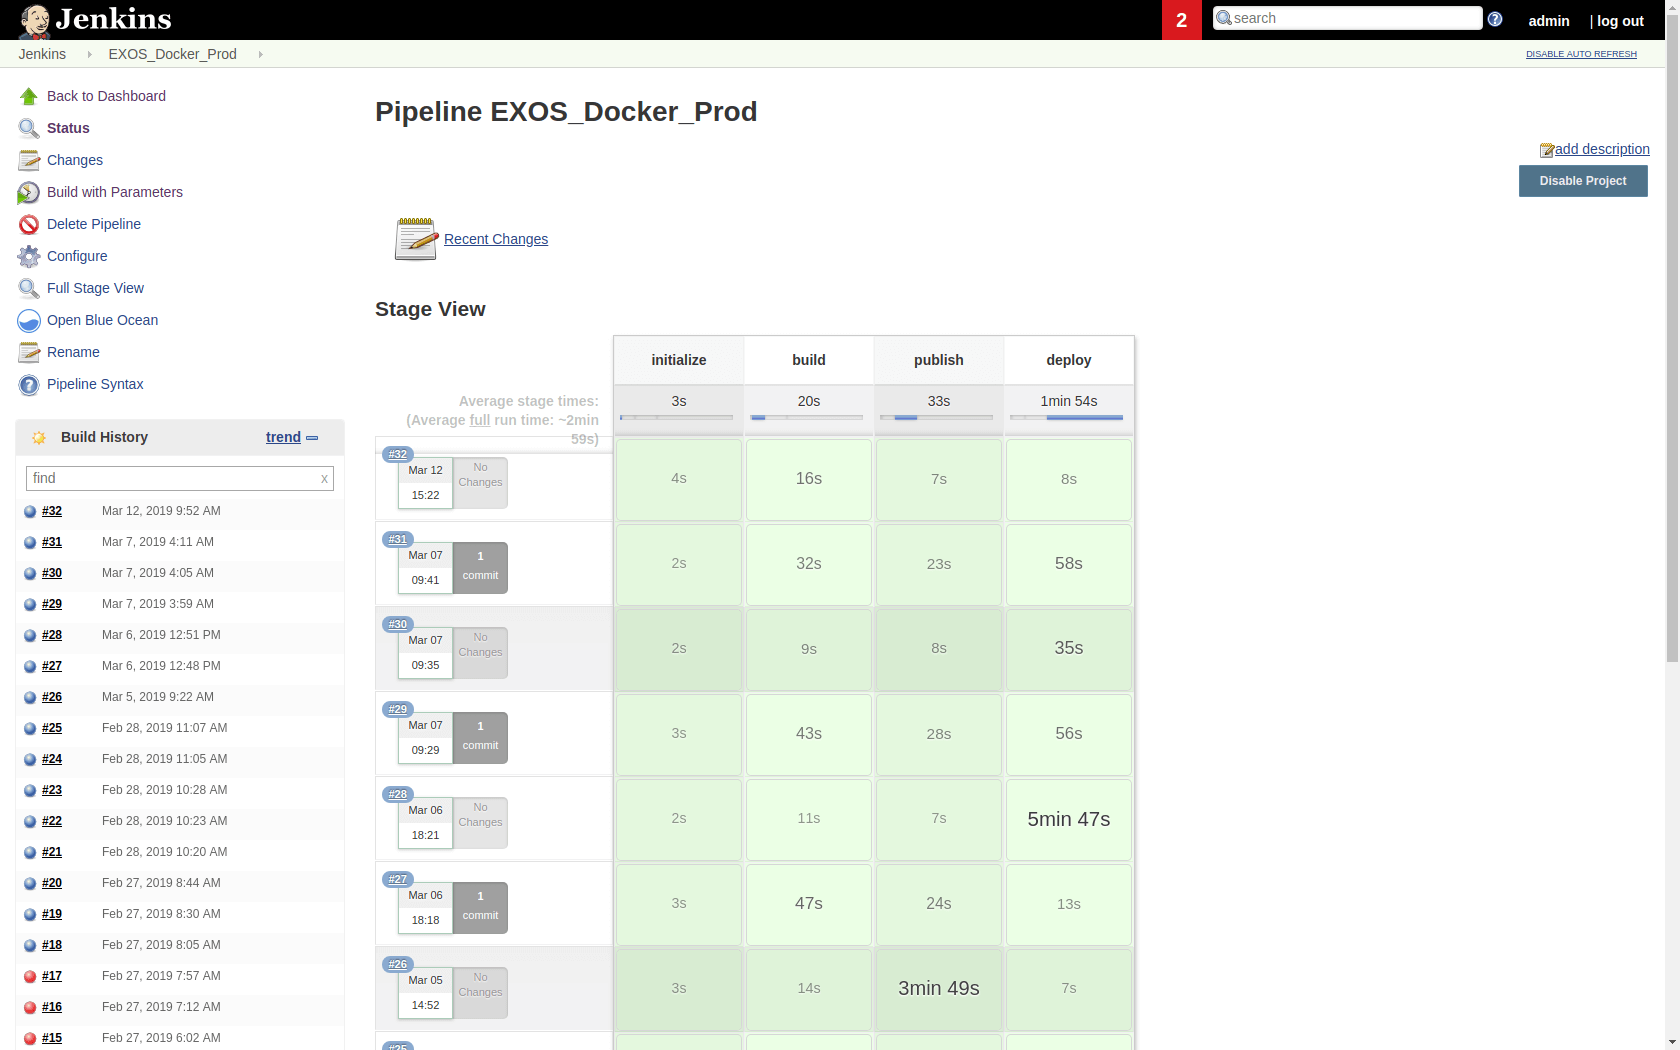
The EXOS Container Platform can be used to provide the complete CI/CD Pipeline setup assisting the DevOps. Any Code Pushed to the Source Version Control (like GIT), gets automatically pulled by the CI Engine (like Jenkins).
The Jenkins Integrator is a Master-Slave configured. The Jenkins Master will build the Docker Image in one of the available Jenkins Slave and then pushes the Image to the Private Registry. It then instructs the EXOS Container Platform to pull the latest version of the docker image from the registry. Changes can be reviewed and can be rolled back in case it doesn't serve the purpose correctly.
PRIVATE REGISTRY
One of the things that make Docker so useful is how easy it is to pull ready-to-use images from a central location, Dockers’ Central Registry. It is just as easy to push our own image (or collection of tagged images as a repository) to the same public registry so that everyone can benefit from our newly Dockerized service.
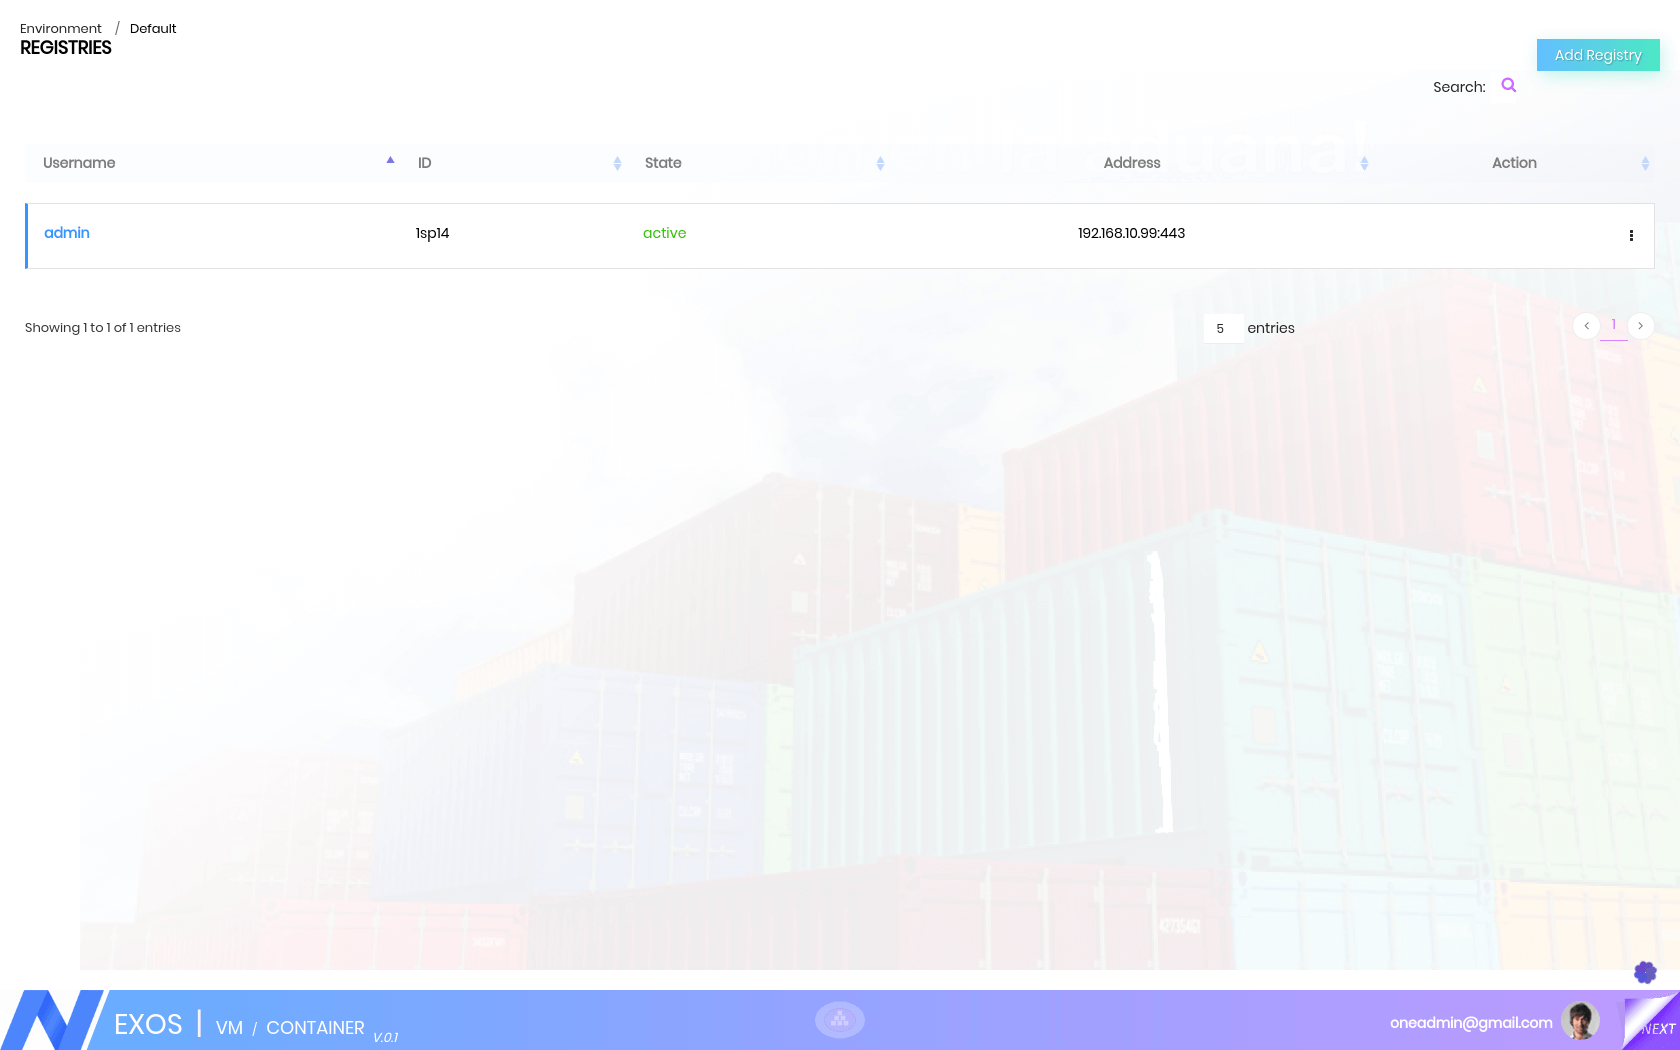
But sometimes we can’t share our repository with the world because it contains proprietary code or confidential information. For that reason, we are introducing an easy way to share repositories on our own registry so that we can control access to them and still share them among multiple Docker daemons. We can decide if our registry is public or private.
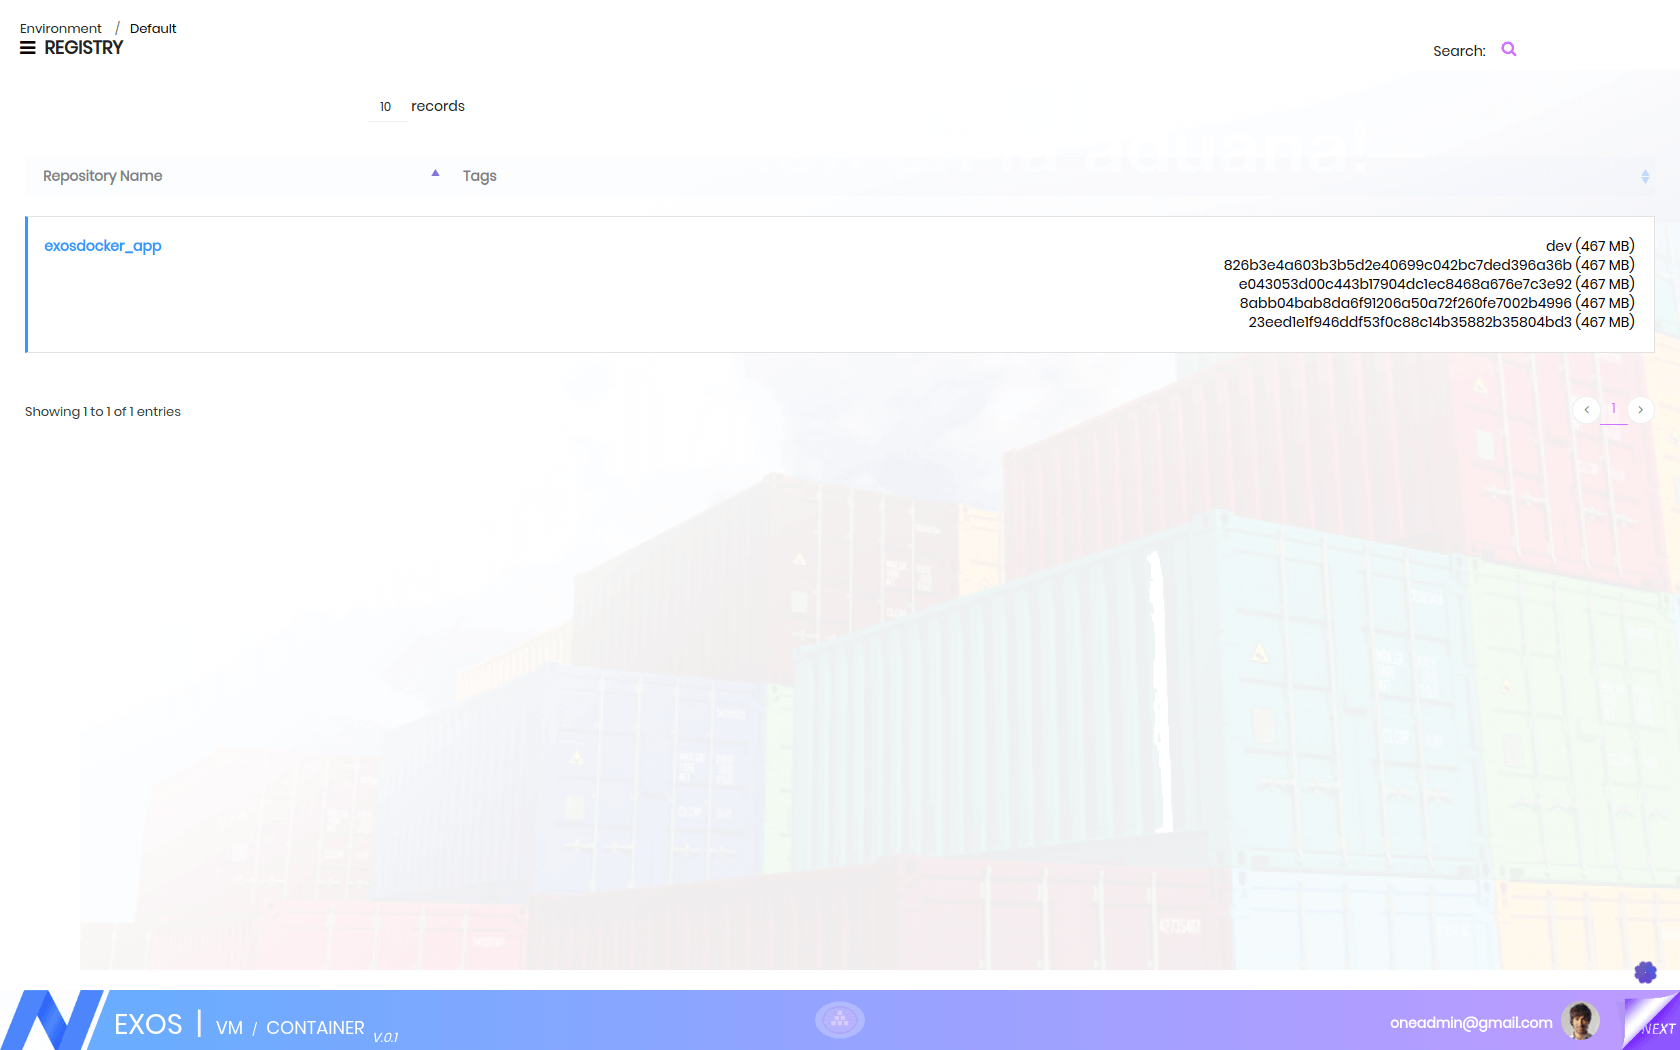
A hosted repository using the Docker repository format is typically called a private Docker registry. The Private Registry is configured to house private Docker images which are proprietary to the enterprise. It can be used to upload your own container images as well as third-party images. This will provide the native Docker registry functionality but within the firewall.
The private registry ensures that the application images are archived, versioned and tagged. This would mean that the development team or the enterprise can switch to a particular service and specific to a particular version at any point in time. This would help in debugging the issue much quicker. It also acts as a custodian of the images, which forms the basis of the container operation.
CATALOG
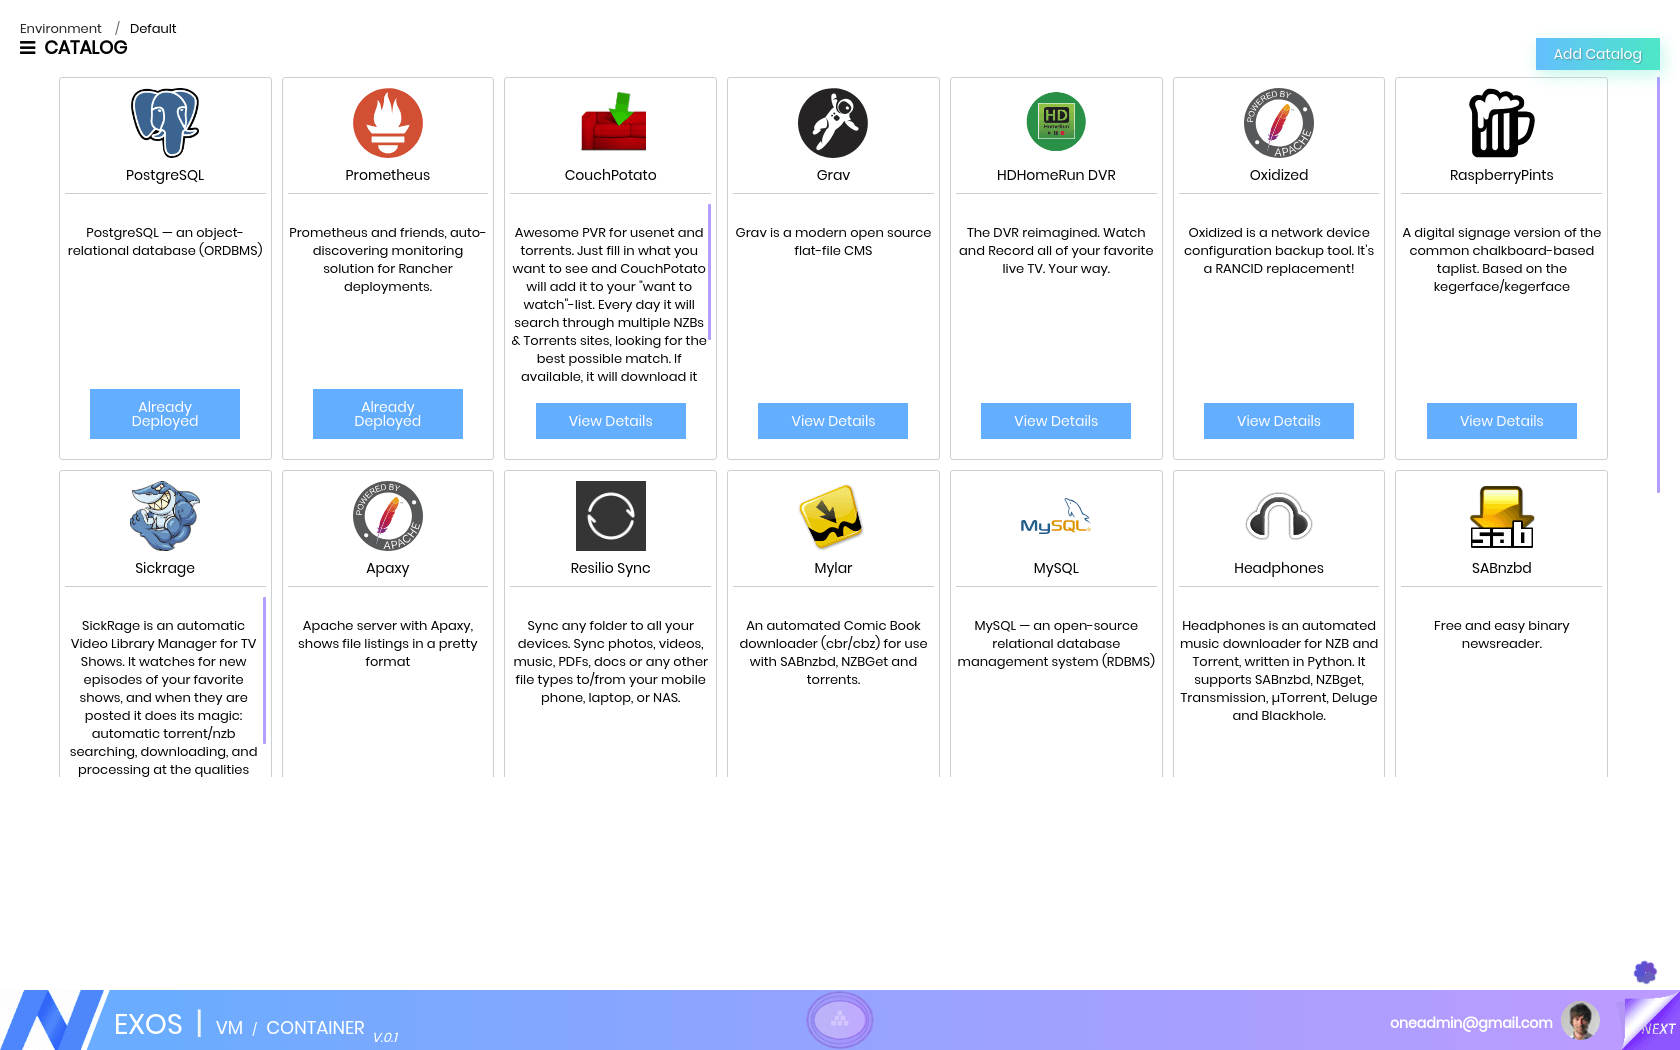
EXOS provides a catalog of application templates that make it easy to deploy these complex stacks. Catalogs are GitLab repositories filled with applications that are ready-made for deployment. Think of them as templates for deployments. By accessing the Catalog tab, you can view all the templates that are available in the enabled catalogs.
The Library catalog contains templates from the library catalog and the Community catalog contains templates from the community-catalog. EXOS will only be maintaining support for the certified templates in the library.
EXOS Container Platform has an app catalog that enables one-click deployments of many popular software stacks like Jenkins, MySQL, Maria, GlusterFS etc. This Application stack can be provisioned in a click of a button empowering the developer community in getting the required services in instant.
Adding a catalog is as simple as adding a catalog name, a URL and a branch name. There are two types of catalogs that can be added to the EXOS Container. There are global catalogs and environment catalogs. In a global catalog, the catalog templates are available in all environments. In an environment catalog, the catalog templates are only available in the environment that the catalog is added to.
The EXOS Container catalog service requires private catalogs to be structured in a specific format in order for the catalog service to be able to translate it into EXOS Container. Catalog templates are displayed in EXOS Container based on what container orchestration type that was selected for the environment.
The time that takes in setting up the supporting development environment and also setting up some environment for rapid prototyping or confirming a hypothesis is very large. This time consumption activity would de-rail the development activity as well. The Catalog feature would assist in this situation and provide a quick environment for the development team to leverage and develop faster.
PROMETHEUS AUTO SCALING AND MONITORING
Monitoring applications and application servers is an important part of today’s DevOps culture & process. We want to continuously monitor your applications and servers for application exceptions, server CPU & memory usage, or storage spikes. We also want to get some type of notification if CPU or memory usage goes up for a certain period of time or service of our application stops responding so you can perform appropriate actions against those failures or exceptions.
In EXOS, you can create receiver hooks, which provides a URL that can be used to trigger action inside of EXOS. For example, the receiver hooks can be integrated with external monitoring systems to increase or decrease containers of a service. In API -> Webhooks, you can view and create new receiver hooks. By using a receiver hook to scale services, we can implement auto-scaling by integrating with external services.
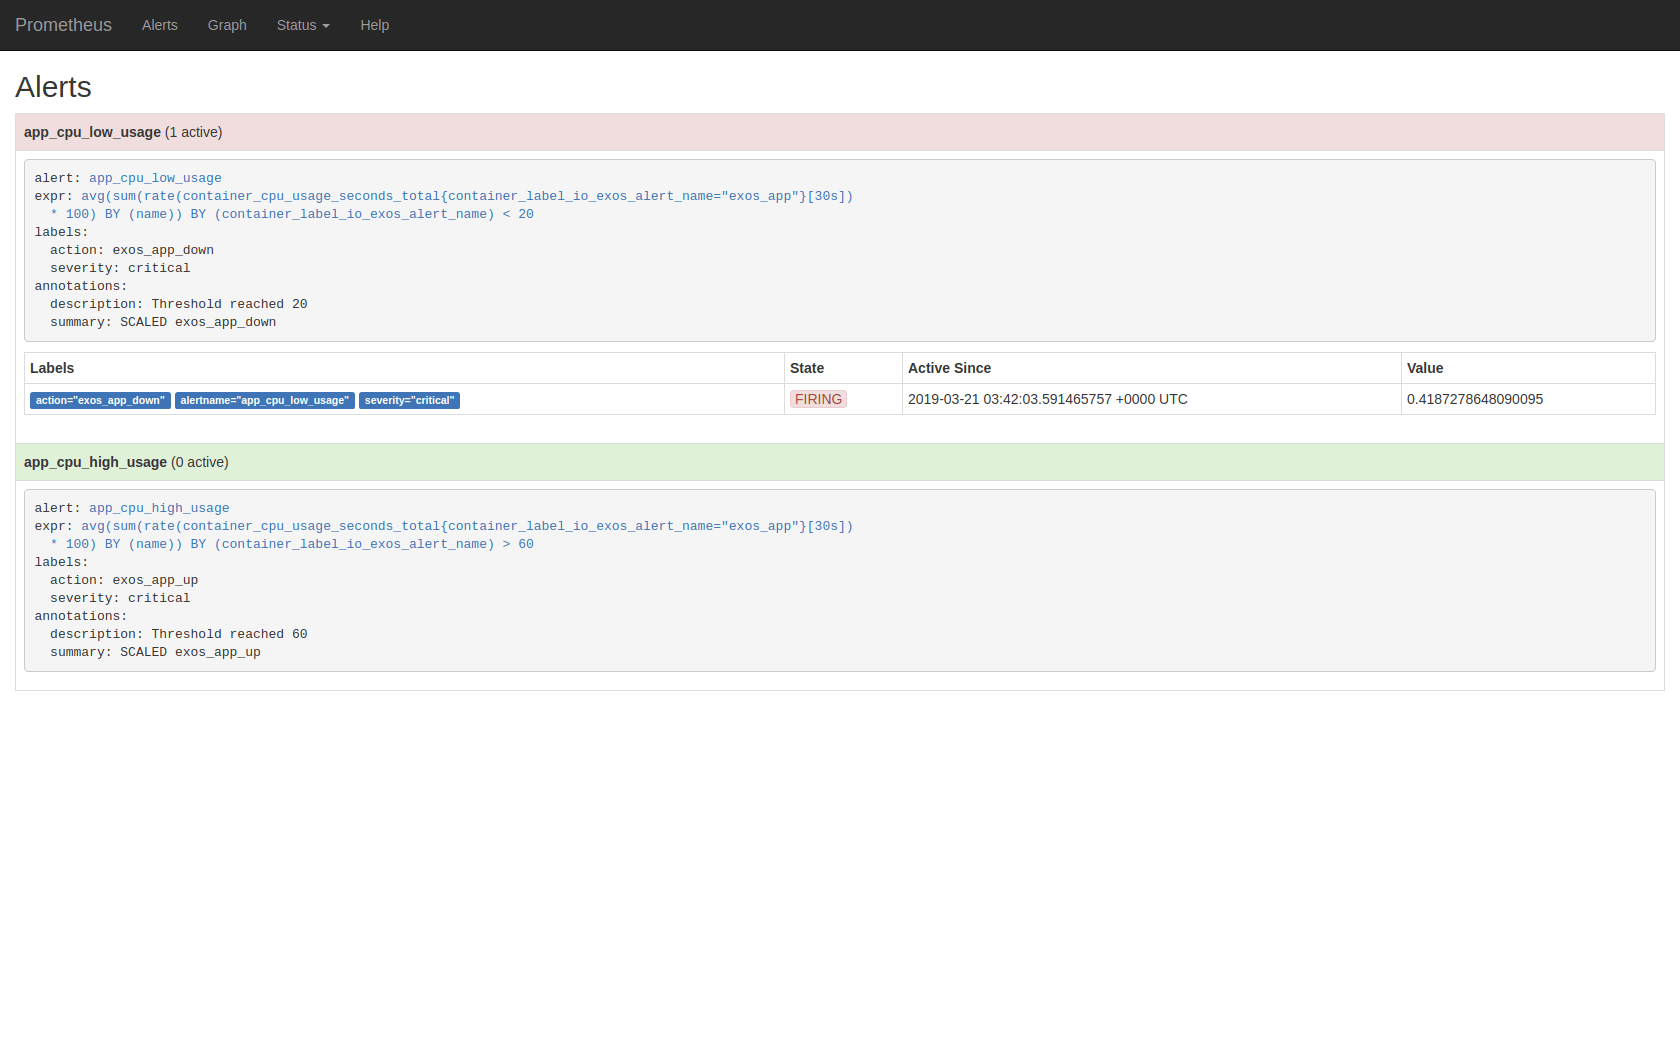
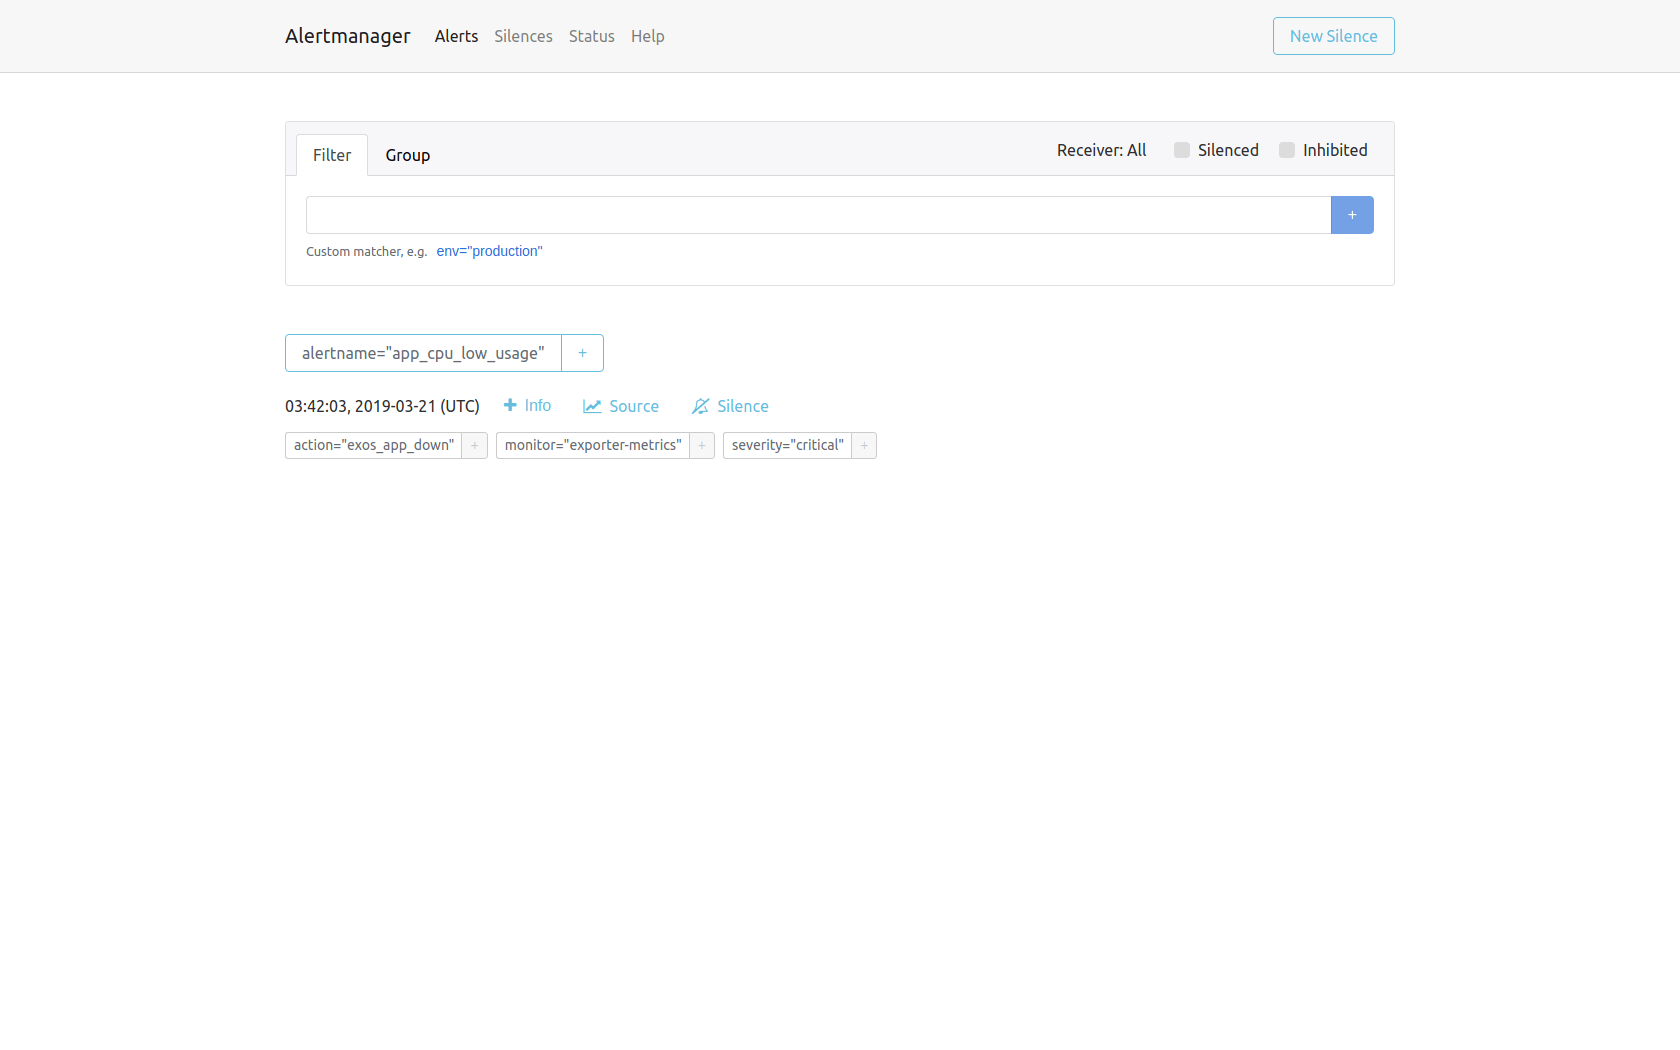
Prometheus is offered through the EXOS Catalog and can be found under the Catalog. Launch Prometheus from the catalog entry. Within the Prometheus stack, find the service called Prometheus, which is exposed on port 9090 In order to call the receiver hook, Alert manager will need to be launched. We can add it to the Prometheus stack.
After Prometheus and Alert manager have been updated with alerts and hooks, make sure the services were restarted in order to have the configurations updated and active. For the services that alerts have been added, the services will automatically be scaled up or down based on the receiver hook that was created.
With Prometheus Monitoring and Auto scaling, the dynamic surge of request to a particular service can be addressed transparently to the consumer of the service. With the Scaling based on the threshold limits, the number of servers actually serving the request is scaled up or down resulting in getting the optimum performance for the service.
Testing7
Testing8
Testing9
Testing10
Testing11
Testing12


